
Abstract
Objective. Plastic scintillator detectors (PSDs) have demonstrated ability to meet requirements of small field dosimetry. Medscint developed a 1 mm long, 1 mm diameter cylindrical PSD with effective volume of 0.8 mm3. Clinically relevant, small field dosimetric properties of this detector, combined with a novel scintillation dosimetry system—HYPERSCINT RP-200, and HYPERDOSE analysis software were evaluated in this study. Approach. This novel scintillator-based dosimetry system was characterized with 6 MV-WFF and 10 MV-FFF x-ray beams delivered by Varian TrueBeamTM linear accelerator. The detector was characterized for leakage, short-term repeatability, dose response linearity, angular response, dose rate response, and field size dependence for radiation field sizes of 0.25 × 0.25 to 10 × 10 cm2. Measured detector specific output ratios were compared with microDiamond output factors to determine small field output correction factors,  Main results. The dosimetry system showed excellent short-term repeatability with standard deviation of only 0.04 ± 0.01%. It demonstrated good dose linearity with variations less than 1.0% for 14.4 cGy and above. The dosimetry system was found to be independent of dose rate and angle of irradiation, with deviations for both below 0.5%. Leakage was found to be comparable to background readings. For 6 MV-WFF energy beams, detector specific output ratios for field sizes down to 1 × 1 cm2 agreed with output factors measured with PTW TN60019 microDiamond, thus,
  equates to unity for these field sizes. For 10 MV-FFF energy beams, detector specific output ratios for field sizes down to 2 × 2 cm2 agreed with PTW TN60019 microDiamond output factors, thus,
  equates to unity for these field sizes.
  for field sizes down to 0.5 × 0.5 cm2 were determined to be within 6% of unity for both 6 MV-WFF and 10 MV-FFF energy beams. Significance. The HYPERSCINT RP-200 dosimetry system coupled with a 0.8 mm3 PSD showed excellent dosimetric properties and was found to be clinically relevant for relative dosimetry down to field sizes of 0.5 × 0.5 cm2 and potentially smaller.
Export citation and abstract BibTeX RIS

Original content from this work may be used under the terms of the Creative Commons Attribution 4.0 licence. Any further distribution of this work must maintain attribution to the author(s) and the title of the work, journal citation and DOI.
1. Introduction
Modern radiation therapy sees increased use of small fields for treatment of tumours through advances in highly specialized techniques such as intensity modulated radiotherapy (IMRT), volumetric-modulated arc therapy (VMAT), stereotactic radiosurgery (SRS), stereotactic radiotherapy (SRT), and stereotactic ablative radiotherapy (SABR). These treatments can be delivered using a linear accelerator equipped with mini-, micro-, or high definition (HD) multi-leaf collimators (MLCs). Most treatments are performed in 6–10 MV energy range, for example SABR for lung cancer uses 6 MV beams and 10 MV beams in 96% and 3% of all cases, respectively, (Palmans et al 2018). This is following International Commission on Radiation Units and Measurements recommendations as use of higher energy beams is not justified in small field SRT (ICRU 2014) due to higher dose outside penumbra region, extension of interface phenomenon, increased photo-neutron production, and wider penumbra of higher energy beams (IAEA 2017, ICRU 2010). Since small fields are more and more common, small field dosimetry becomes increasingly important.
The main detector-related challenges in small field dosimetry are fluence perturbation effects, principally caused by material and density differences between detector material and water (Bouchard et al 2015), as well as volume averaging effects and detector positioning difficulties. To overcome these challenges, the ideal small field detector samples fluence at a point (to reduce volume averaging effects and provide high spatial resolution), is water equivalent (to remove fluence perturbation effects), offers linear response with dose, is independent of dose rate, energy, and direction of irradiation (to eliminate correction factors) (IAEA 2017). Additionally, water resistance and direct-real-time readout are beneficial for ease of use.
Beddar et al (1992a, 1992b) showed that plastic scintillators are water equivalent, are independent of energy, dose and dose rate, boast a fast response time, can be manufactured to small sizes (sub-mm), and exhibit less radiation damage effects than other detectors such as diodes. Continued research and development efforts over the last 30 years have led to further developments in scintillator detectors such as an ability to subtract Cherenkov light produced in optical transmission fibers (Fontbonne et al 2002, Guillot et al 2011), improved cladding for enhanced internal total reflection that minimizes loss of signal (Aoyama et al 1997), and multipoint readouts (Therriault-Proulx et al 2012) allowing dosimetry in diverse and challenging conditions, including small fields.
The novel HYPERSCINT RP-200 (HS RP-200) plastic scintillator detector (PSD) dosimetry system, developed by Medscint Inc. (Quebec, QC., Canada), optimizes true signal isolation from PSD for the purpose of scintillation dosimetry, offering accurate and non-perturbating measurements for small field dosimetry applications. Additionally, this system automatically separates the stem effects via chromatic removal through the implementation of a hyperspectral approach (Therriault-Proulx et al 2012). The stem effect removal accounts for fluorescence and Cherenkov signal generation in the optical cables as well as fiber spectral attenuation, which have a different spectral signature compared to the scintillator signal originating in PSD allowing its isolation. This facilitates a more accurate and precise calibration (Archambault et al 2012). Furthermore, Medscint Inc. offers customizable PSD probe designs in sub-millimetric sizes.
Previously, the HS RP-100 dosimetry system—another system by Medscint Inc., with a 3-point PSD probe was evaluated by Jean et al (2021) for dosimetric performance. Through their work, a linear response was established in the range of doses from 1 to 600 cGy. It was shown that depth dose to 200 mm and full width at half maximum (FWHM) of lateral dose profiles can be measured within 1.1% and 2.3% accuracy, respectively. Also, output factors were measured for field sizes from 15 × 15 cm2 down to 2 × 2 cm2 with a maximum difference of 1.78% compared to ion chamber output factor measurements. In 2022, Schoepper et al used the same dosimetry system, but with a 1 mm × 3 mm PSD probe to show response linearity with dose (5–1000 cGy), as well as dose rate (100–600 cGy min−1) and field size (30 × 30 to 3 × 3 cm2) independence. They measured depth dose down to 15 cm within 1.14% accuracy and demonstrated minimal angular dependence (Schoepper et al 2022).
The most comparable detector out on the market is the Exradin W2 (Standard Imaging Inc., Middleton, WI). It is a 1 mm × 1 mm PSD probe featuring water equivalency, independence from temperature, dose rate, and energy, and it comes with Cherenkov correction as well, through the SuperMAX electrometer. This detector has been well documented, and has been shown to be dosimetrically similar to Exradin W1, another PSD by Standard Imaging Inc. (3 mm length by 1 mm diameter) (Galavis et al 2019).
Although PSDs and scintillator signal acquisition systems, similar to HYPERSCINT RP-200, have been reported in literature (Galavis et al 2019, Jean et al 2021, Schoepper et al 2022), to our knowledge, there are no publications showing the characteristics of the HS RP-200 dosimetry system coupled to a small 0.8 mm3 PSD probe. In this study, a full characterization, in the clinical setting, of this dosimetry system was performed. The system was evaluated with respect to fundamental dosimetric properties including leakage, short-term repeatability, dose–response linearity, dose rate dependence, field size dependence, and angular dependence. Additionally, relative output factors were measured down to field sizes of 0.25 × 0.25 cm2, and small field output correction factors were evaluated for 6 MV with flattening filter (6 MV-WFF) and 10 MV flattening filter free (10 MV-FFF) beams.
2. Methods
2.1. Dosimetry system description
The HYPERSCINT RP-200 (HS RP-200) dosimetry system consists of three parts (i) PSD probe, (ii) acquisition system, and (iii) software. The probe investigated in this work is a single-point, polyvinyltoluene detector, which has a sensitive volume of 0.8 mm3 given by its diameter of 1 mm and length of 1 mm. This probe is housed in a black nylon envelope and is optically coupled to a 20 m long 1 mm diameter PMMA optical fiber core clad in a polyethylene jacket. The fiber optical cable is attached to the HS RP-200 acquisition system with a proprietary connector. The signal is read out using Medscint's proprietary software. For the remainder of this paper, this particular set up consisting of the above mentioned probe, acquisition system, and software will be referred to as HS RP-200–1 × 1.
2.2. Measurements
First, using a Varian TrueBeamTM STx linear accelerator (linac) (Varian Medical Systems, Palo Alto, CA), a four-component calibration procedure specified by Medscint, including scintillation, fluorescence, Cherenkov, optical fiber spectral attenuation, and system dose calibration components, was performed. The scintillation and fluorescence components were obtained by performing a high intensity kV irradiation, in fluouroscopy mode, of only the probe end, followed by irradiation of only the optical fiber, for 60 s and 120 s respectively. The Cherenkov calibration and optical fiber spectral attenuation consisted of four components, and included irradiating two sections of optical fiber laying perpendicularly to the MV energy beam at isocenter with gantry angles of 45° and 315°. Irradiating different sections of fiber allows the HS RP-200 system to evaluate and subtract the Cherenkov component from the signal of the detector. Finally, the dose calibration was performed by irradiating the probe to a known dose. A repetitive integration time of 1 s was used for all measurements as recommended in the user manual.
The dosimetric performance tests were carried out under setup conditions with lights and monitor displays turned off to prevent signal contamination from ambient light (although the PSD probe is light-tight). Majority of irradiations were carried out with a Varian TrueBeamTM STx linac equipped with an HD 120TM MLC featuring leaves measuring 2.5 mm in width. These irradiations were delivered with either a 6 MV-WFF beam with a dose rate of 600 monitor units min−1 (MU min−1) or 10 MV-FFF beam with a dose rate of 2400 MU min−1. Detector specific output ratio measurements were also conducted with Varian TrueBeamTM linac equipped with Millennium MLC with a leaf width of 5 mm. In dose rate dependence measurements, the dose rate was varied from 40 to 2400 MU min−1. The PSD probe was positioned in a solid water phantom (Gammex-RMI Ltd, Nottingham, UK, model 457–320) perpendicularly to the beam, at a depth of 10 cm of solid water serving as backscatter, and source-to-surface distance of 100 cm. The phantom had L × W × H dimensions of 30 cm × 30 cm × 20 cm. The measurement setup was applied to the subsequent subsections except for the study of angular dependence, where a cylindrical water phantom was used. The probe was connected to the HS RP-200 signal acquisition system, which was placed outside the linac bunker. The measurements were repeated on several separate occasions spanning over eight weeks to account for any potential setup and linac output variations.
2.2.1. Pre/post irradiation leakage
In order to determine leakage, dark current readings were taken prior to and post irradiation. An increased dose reading immediately post irradiation compared to one minute post irradiation would indicate leakage. Under the reference conditions mentioned above, a ten minute measurement was performed pre-irradiation. Next, 500 MUs were delivered to the PSD within a 10 × 10 cm2 field size, and a five-second measurement was taken immediately afterward. Following a 60 s delay post 500 MUs irradiation, another five-second leakage measurement was taken (Poder 2020).
2.2.2. Short term repeatability
Short term repeatability was obtained by irradiating the PSD 10 times in the reference conditions. Each irradiation delivered 200 MUs with a 5 × 5 cm2 field size. Comparison of individual readings to the average was used to determine the short term reproducibility.
2.2.3. Dose–response linearity
The relationship between dose measured by the PSD and the dose delivered was obtained by successively delivering varying dose to the PSD from 5 up to 2000 MUs, in reference conditions with a 5 × 5 cm2 field size. The dose readings were plotted against monitor units delivered to check for linear relationship. Linac output linearity was checked using Farmer chamber and confirmed to be within 0.3% down to 5 MU and to within 2% down to 1 MU.
2.2.4. Dose rate dependence
The PSD response to dose rate was measured using linac defined dose rates ranging from 40 to 2400 MU min−1. More specifically, the 6 MV-WFF beam delivered dose rates of 40–600 MU min−1 and the 10 MV-FFF beam delivered dose rates of 400–2400 MU min−1. Under reference conditions, with a 5 × 5 cm2 field size, 200 MUs were delivered per dose rate. The dose measured per dose rate was normalized to 6 MV-WFF 600 MU min−1 readings and then directly compared against all other dose rate readings.
2.2.5. Field size dependence (output factors)
2.2.5.1. Field size specification
Following the IAEA TRS-483 guidelines (IAEA 2017), field size was defined as the full width at half maximum (FWHM) of in-plane and cross-plane profiles of the field at the position of the detector. Then, equivalent square field size Sclin was calculated as follows

where a is the length and b is the width of a rectangular field defined by the FWHM in-plane and cross-plane dosimetric profiles. Lateral beam profiles were measured using RTQA2 Gafchromic film (Ashland Advanced Materials, Bridgewater, NJ). The field size was MLC defined with jaws set a few millimeters outside MLC dimensions, as specified in table 1, to reduce jaw aperture uncertainties (Cranmer-Sargison et al 2011). Jaw and MLC settings for field sizes 1 × 1 cm2 and larger reproduced settings by Bassinet et al (2013). In that study Bassinet et al, using a Clinac 2100, measured field output factors for active and passive detectors including shielded and unshielded diodes, LiF microcubes, films, ion chambers and microDiamond.
Table 1. Field sizes defined via nominal dimensions as given by combination of MLC and jaw positions, and equivalent field size as defined by FWHM of the in-plane and cross-plane profiles obtained from Gafchromic film.
| MLC size (cm2) | Jaw size (cm2) | Sclin TrueBeamTM STx (cm2) | Sclin TrueBeamTM (cm2) |
|---|---|---|---|
| 0.25 × 0.25 | 1 × 1 | 0.28 | — |
| 0.5 × 0.25 | 1 × 1 | 0.33 | — |
| 0.5 × 0.5 | 1 × 1 | 0.53 | 0.46 |
| 0.75 × 0.75 | 1 × 1 | 0.74 | — |
| 1 × 1 | 1.2 × 1.2 | 0.96 | 1.00 |
| 1.25 × 1.25 | 1.4 × 1.4 | 1.16 | — |
| 1.5 × 1.5 | 1.7 × 1.7 | 1.44 | 1.49 |
| 1.75 × 1.75 | 2 × 2 | 1.67 | — |
| 2 × 2 | 4.4 × 4.4 | 1.98 | 2.03 |
| 2.5 × 2.5 | 4.4 × 4.4 | 2.45 | 2.42 |
| 3 × 3 | 4.4 × 4.4 | 2.99 | 3.05 |
| 5 × 5 | 5 × 5 | 4.99 | 4.97 |
| 10 × 10 | 10 × 10 | 9.99 | 9.87 |
2.2.5.2. Output factors
IAEA TRS-483 (IAEA 2017) adopts the formalism by Alfonso et al (2008) and defines field output factors as the absorbed dose for a small (clinical) field,  relative to the absorbed dose in a machine specific reference field,
  as
as
where  is the detector reading in the small field,
  is the detector reading in the machine specific reference field, and
  is the small field output correction factor. The detector specific output ratio is defined as
In this work detector specific output ratios were measured with the HS RP-200–1 × 1 system and then  factors were derived from comparison of these results to output factors measured with two PTW TN60019 microDiamond detectors. A brief comparison to literature is included where field output factors were published for the same fields.
2.2.5.3. PSD positioning
The effective point of measurement, as indicated on the probe at 2.5 mm from the tip, was placed at the center of the smallest linac-defined field (0.25 × 0.25 cm2) by means of in-plane and cross-plane profile measurements. Using the scanning approach, the detector was placed at the position which gave the maximum reading by shifting detector in lateral and superior–inferior directions.
2.2.5.4. Measuring output factors
Under reference conditions, the PSD was irradiated using Varian TrueBeamTM STx linear accelerator to 100 MU per field size for field sizes of 0.25 × 0.25 cm2 to 10 × 10 cm2 as outlined in table 1. Additionally, for field sizes of 10 × 10 cm2 down to 0.5 × 0.5 cm2, as outlined in table 1, PSD was irradiated with 100 MU per field size with Varian TrueBeamTM linac. Detector specific output ratios for a specific field size were defined as the ratio of the reading at that field size to the reading at a field size of 10 × 10 cm2 (machine specific reference field). These output ratios were then compared with measurements performed using a PTW TN60019 microDiamond (PTW, Freiburg, Germany) corrected with small field correction factor following IAEA TRS-483 under the same irradiation conditions. The measured values were compared to published data.
2.2.6. Angular dependence
Since the PSD is cylindrical, no angular dependence in this direction is expected. To confirm this, the PSD was placed in the center of a plastic-shell 20 cm diameter cylindrical phantom filled with water that was positioned at the isocenter of the linac. Iso-centric position of the water phantom was verified using cone beam computed tomography (CBCT) imaging. The PSD was irradiated with 200 MU and a 5 × 5 cm2 field size at gantry angles from 0° to 340° in 20° increments. Relative comparison of dose readings for each gantry angle was calculated with respect to the reading at 0° angle.
2.2.7. Estimated uncertainties
Generally, uncertainties were evaluated as the standard deviation (1 confidence interval) of three repeated measurements. Uncertainties for output factor were evaluated as a quadrature sum of Type A and Type B uncertainties (BIPM et al
2008). Type A uncertainties were derived from the standard deviation of three repeated measurements in a given setup. Type B uncertainties were estimated by performing independent sets of repeated measurements on different days. The average standard deviation of the resulting datasets was then calculated to evaluate uncertainties related to setup repeatability and linear accelerator output variance. Type B uncertainty also includes small field output correction factor uncertainty, where applicable. For Varian TrueBeamTM STx, the total output factor or detector specific output ratio uncertainties were evaluated to 0.9%–1.4% for PTW TN60019 (#1) microDiamond, 0.6%–1.4% PTW TN60019 (#2) microDiamond, and 0.4%–2.8% for HS RP-200–1 × 1, depending on field size, with smaller field sizes carrying larger uncertainty. For Varian TrueBeamTM those uncertainties were evaluated to 1.0%–1.6% for PTW TN60019 (#1) microDiamond, 0.7%–1.3% for PTW TN60019 (#2) microDiamond, and 0.4%–1.7% for HS RP-200–1 × 1.
confidence interval) of three repeated measurements. Uncertainties for output factor were evaluated as a quadrature sum of Type A and Type B uncertainties (BIPM et al
2008). Type A uncertainties were derived from the standard deviation of three repeated measurements in a given setup. Type B uncertainties were estimated by performing independent sets of repeated measurements on different days. The average standard deviation of the resulting datasets was then calculated to evaluate uncertainties related to setup repeatability and linear accelerator output variance. Type B uncertainty also includes small field output correction factor uncertainty, where applicable. For Varian TrueBeamTM STx, the total output factor or detector specific output ratio uncertainties were evaluated to 0.9%–1.4% for PTW TN60019 (#1) microDiamond, 0.6%–1.4% PTW TN60019 (#2) microDiamond, and 0.4%–2.8% for HS RP-200–1 × 1, depending on field size, with smaller field sizes carrying larger uncertainty. For Varian TrueBeamTM those uncertainties were evaluated to 1.0%–1.6% for PTW TN60019 (#1) microDiamond, 0.7%–1.3% for PTW TN60019 (#2) microDiamond, and 0.4%–1.7% for HS RP-200–1 × 1.
3. Results
3.1. Pre/post irradiation leakage and short term repeatability
An average of three 10 min measurements under no irradiation of the PSD yielded a reading of 0.91 ± 0.3 cGy. Post irradiation readings indicated minimal leakage. The 5 s reading immediately post 500 MU irradiation (time = 0 s post irradiation) was 0.003 ± 0.005 cGy and the 5 s reading one minute post irradiation (time = 60 s post irradiation), was 0.005 ± 0.005 cGy, both well below the background reading. Comparing results on the same time scale of 5 s, both post-irradiation readings are comparable to the background reading of 0.008 ± 0.002 cGy/5 s.
The average of 10 readings taken for 200 MUs delivered per measurement in a 5 × 5 cm2 field size was 113.33 cGy with a standard deviation (SD) of 0.04 ± 0.01%, where uncertainty is given by standard error (SE) defined by  where N is the number of samples .
3.2. Dose–response linearity
Dose–response of this dosimetry system showed a linear relationship with an R2 value of ~1 and standard error of fit 0.26 cGy (figure 1). However, for the lowest delivered dose of 5 MU, the deviation of the measured from the expected linear dose response was 5.9%. Otherwise, differences fell below ±1% for doses higher than 25 MU. At the measurement point in this setup 1 MU = 0.574 cGy.
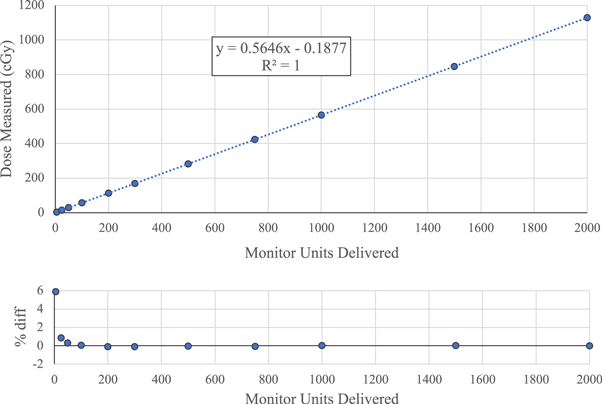
Figure 1. Dose linearity of HS RP-200–1 × 1 system. Subplot shows the percent deviation of the measured dose from the dose expected from the linear fit. Error bars are too small to be seen in figure, they range from 0.008% to 0.06% for 10–2000 MU, and 0.5% for 5 MU.
Download figure:
Standard image High-resolution image3.3. Dose rate dependence
The HS RP-200–1 × 1 showed minimal dose rate dependence between 200 and 2400 MU min−1. The PSD measured constant dose with largest discrepancy of 0.48% at dose rate of 100 MU min−1, otherwise discrepancy was within 0.10% (figure 2). For dose rates below 100 MU min−1, the discrepancy increased up to 1.56% at the lowest dose rate measured (40 MU min−1).
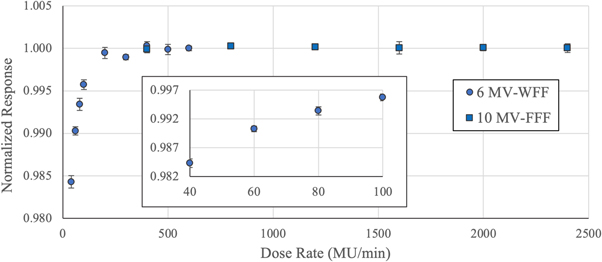
Figure 2. Dose rate response of HS RP-200–1 × 1 system. The response is normalized to 600 MU min−1 delivered with 6 MV-WFF energy beam. Circles are 6 MV-WFF energy beam. Squares are 10 MV-FFF energy beam.
Download figure:
Standard image High-resolution image3.4. Field size dependence (detector specific output ratio)
3.4.1. 6 MV-WFF beams
Figure 3 displays detector specific output ratios measured with HS RP-200–1 × 1 for 6 MV-WFF energy beam delivered with Varian TruebeamTM STx for field sizes of 0.25 × 0.25 cm2 to 10 × 10 cm2. This figure also includes corrected field output factors measured with two PTW TN60019 microDiamond detectors and data from Lechner et al (2022) for field sizes of 0.5 × 0.5 cm2 to 10 × 10 cm2. For field sizes of 1 × 1 cm2 and larger, the agreement between HS RP-200–1 × 1 and PTW TN60019 microDiamond detectors with appropriate corrections was within measurement uncertainty. For field size of 0.5 × 0.5 cm2, the detector specific output ratio measured with HS RP-200–1 × 1 was 4.3% lower than corrected field output factor measured with PTW TN60019 (#1) microDiamond detector and 3.7% lower than that measured with PTW TN60019 (#2). Field output factors for field sizes smaller than 0.5 × 0.5 cm2 were not measured with microDiamond because published small field correction factors for these field sizes have large reported uncertainties (Alhakeem and Zavgorodni 2018).
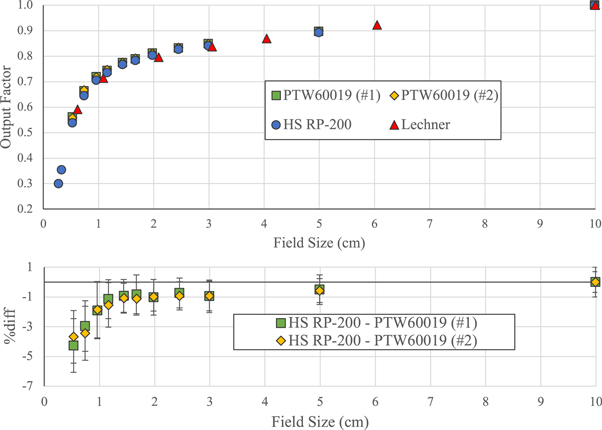
Figure 3. Detector specific output ratios for 6 MV-WFF energy beam for Sclin field sizes ranging from 0.25 × 0.25 to 10 × 10 cm2 as defined in table 1, measured with HS RP-200–1 × 1 (blue circles). These are compared to corrected output factors for Sclin field sizes ranging from 0.5 × 0.5 to 10 × 10 cm2 as defined in table 1, measured with two PTW TN60019 microDiamond detectors (green squares and yellow diamonds). Measurements were performed on Varian TrueBeamTM STx with 2.5 mm width HD-MLC leaves. Output factor data from Lechner et al (2022) (red triangles) is also included. Subplot shows the percent difference between HS RP-200–1 × 1 and microDiamond detectors.
Download figure:
Standard image High-resolution imageThe detector specific output ratios measured with HS RP-200–1 × 1 and corrected field output factors measured with two PTW TN60019 microDiamond detectors for Varian TrueBeamTM 6 MV-WFF energy beam are displayed in figure 4. Again, agreement was within measurement uncertainty for field sizes of 1 × 1 cm2 and larger. Largest difference was seen at the smallest field size of 0.5 × 0.5 cm2 of 2.9% and 4.9% between HS RP-200–1 × 1 and PTW TN60019 (#1) and (#2), respectively.

Figure 4. Detector specific output ratios for 6 MV-WFF energy beam for Sclin field sizes ranging from 0.5 × 0.5 to 10 × 10 cm2 as defined in table 1, measured with HS RP-200–1 × 1 (blue circles). These are compared to corrected output factors for the same Sclin field sizes, measured with two PTW TN60019 microDiamond detectors (green squares and yellow diamonds). Measurements were performed with Varian TrueBeamTM with 5 mm width MLC leaves. Output factor data from Lechner et al (2022) (red triangles) is also included. Subplot shows the percent difference between HS RP-200–1 × 1 and microDiamond detectors.
Download figure:
Standard image High-resolution imageComparison of detector specific output ratios for two Varian TrueBeamTM models showed little difference. Detector specific output ratios measured with HS RP-200–1 × 1 on Varian TrueBeamTM and Varian TrueBeamTM STx agreed to within 3% for field sizes down to 0.5 × 0.5 cm2. For the field sizes down to 0.6 × 0.6 cm2, comparison of these output ratios to the output factors reported by Lechner et al (2022) for Varian TrueBeamTM STx showed agreement within 1%. However, comparison to Lechner data for Varian TrueBeamTM showed a difference of about 45% for the smallest field size of 0.5 × 0.5 cm2.
3.4.2. 10 MV-FFF beams
Figure 5 displays detector specific output ratios measured with HS RP-200–1 × 1 for 10 MV-FFF energy beam delivered with Varian TruebeamTM STx for field sizes of 0.25 × 0.25 cm2 to 10 × 10 cm2. This figure also includes corrected field output factors measured with two PTW TN60019 microDiamond detectors and data from Lechner et al (2022) for field sizes of 0.5 × 0.5 cm2 to 10 × 10 cm2. For field sizes of 2 × 2 cm2 and larger the agreement between HS RP-200–1 × 1 and PTW TN60019 microDiamond detectors with appropriate corrections was within measurement uncertainty. For field size of 1 × 1 cm2 the detector specific output ratio measured with HS RP-200–1 × 1 was 3.2% lower than corrected field output factor measured with PTW TN60019 (#1) microDiamond detector and 3.6% lower than that measured with PTW TN60019 (#2). For field size of 0.5 × 0.5 cm2 the detector specific output ratio measured with HS RP-200–1 × 1 was 4.8% lower than corrected field output factor measured with PTW TN60019 (#1) microDiamond detector and 5.9% lower than that measured with PTW TN60019 (#2).
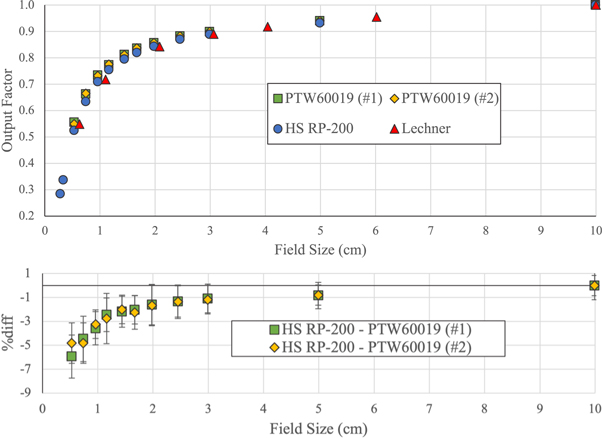
Figure 5. Detector specific output ratios for 10 MV-FFF energy beam and Sclin field sizes ranging from 0.25 × 0.25 to 10 × 10 cm2 as defined in table 1, measured with HS RP-200–1 × 1 (blue circles). These are compared to field output factors for Sclins field sizes ranging from 0.5 × 0.5 to 10 × 10 cm2 as defined in table 1, measured with two PTW TN60019 microDiamond detectors (green squares and yellow diamonds). Measurements were performed with Varian TrueBeamTM STx with 2.5 mm width MLC leaves. Output factor data from Lechner et al (2022) (red triangles) is also included. Subplot shows the percent difference between HS RP-200–1 × 1 and microDiamond detectors.
Download figure:
Standard image High-resolution imageThe detector specific output ratios measured with HS RP-200–1 × 1 and corrected field output factors measured with two PTW TN60019 microDiamond detectors for Varian TrueBeamTM 10 MV-FFF energy beam are displayed in figure 6. Again, agreement was within measurement uncertainty for field sizes of 2 × 2 cm2 and larger. Largest difference was seen at the smallest field size of 0.5 × 0.5 cm2 of 6.2% and 6.4% between HS RP-200–1 × 1 and PTW TN60019 (#1) and (#2), respectively.
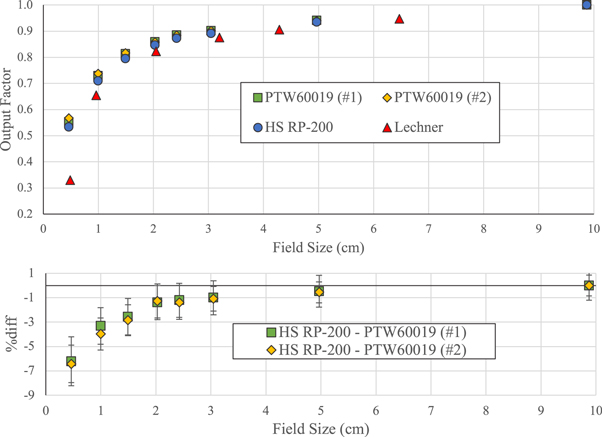
Figure 6. Detector specific output ratios for 10 MV-FFF energy beam and Sclin field sizes ranging from 0.5 × 0.5 to 10 × 10 cm2 as defined in table 1, measured with HS RP-200–1 × 1 (blue circles). These are compared to field output factors for the same Sclins field sizes, measured with two PTW TN60019 microDiamond detectors (green squares and yellow diamonds). Measurements were performed with Varian TrueBeamTM with 5 mm width MLC leaves. Output factor data from Lechner et al (2022) (red triangles) is also included. Subplot shows the percent difference between HS RP-200–1 × 1 and microDiamond detectors.
Download figure:
Standard image High-resolution imageLittle difference was seen between detector specific output ratios measured on two Varian TrueBeamTM models. Detector specific output ratios measured with HS RP-200–1 × 1 on Varian TrueBeamTM and Varian TrueBeamTM STx agreed to within 2% for field sizes down to 0.5 × 0.5 cm2. For the field sizes down to 0.6 × 0.6 cm2, comparison of these output ratios to the output factors reported by Lechner et al for Varian TrueBeamTM STx showed agreement within 4%. However, comparison to Lechner data for Varian TrueBeamTM showed a difference of about 52% for the smallest field size of 0.5 × 0.5 cm2.
3.5. Angular dependence
The angular dependence, relative to gantry at 0°, of the investigated PSD is shown in figure 7. The angular dependence was mostly below 0.1%, and the maximum angular dependence was 0.15% ± 0.01% at a gantry angle of 260°.

Figure 7. Angular dependence, normalized to gantry at 0°, of the 1 mm × 1 mm cylindrical PSD. Red lines indicate 0.5% difference.
Download figure:
Standard image High-resolution image
4. Discussion
4.1. Pre/post irradiation leakage and short term repeatability
A dose of 0.91 cGy was recorded over a pre-irradiation measurement spanning 10 min. This is quite interesting considering that part of the calibration procedure was to perform a background reading which is to be subtracted from future measurements. It is therefore expected that a background reading with a correct calibration should be zero. However, the average length of an SRS/SRT treatment at our institution is well below 10 min. Considering an average dose per fraction of 11.7 Gy (based on patients from January 2021—May 2021, inclusive), the 0.91 cGy dark current is less than 0.1% of the average dose delivered, and can be considered clinically insignificant. Readings taken immediately prior to and immediately after irradiation indicated no leakage as all values were comparable to expected background levels.
The short term repeatability of HS RP-200–1 × 1 that was quantified through the standard deviation of 10 readings was 0.04 ± 0.01%. This finding surpasses the short-term repeatability of Extradin W1 PSD, which Carrasco et al (2015) reported as 0.25 ± 0.05% and 0.10 ± 0.07% for respective 15 and 75 cGy irradiations. Also, the percent deviation of 0.04% herein was found to be comparable to the Debnath et al (2021) reported deviations of 0.02% and 0.07% for 100 cGy irradiations for an inorganic scintillating detector in 10 × 10 cm2 and 0.5 × 0.5 cm2 fields, respectively.
4.2. Dose–response linearity
Irradiation of the PSD in the range of 25–2000 MU showed a linear relation between delivered MU and measured signal with less than 1% deviation. At a delivered irradiation of 5 MU, the measured signal deviated by 5.9% from the expected value defined by linear fit. Considering that 5.9% is only 0.16 cGy under these irradiation conditions, this difference is likely to be negligible in many clinical situations. However, during VMAT delivery, considerable fraction of the dose is delivered in small portions, therefore, the impact of non-linearity of this PSD on VMAT dosimetry could be worthy of further investigation.
These results are similar to findings by Schoepper et al (2022) for the HS RP-100 readout system coupled to a 1 mm × 3 mm PSD probe. The group reported a difference of 2.93% at 5 MU, and differences lower than 1% for 10 MU and higher. Jean et al (2021) demonstrated a similar trend with differences over 2% for 5 MU doses and lower, and differences less than 1% for 10 MU and higher. They used the HS RP-100 acquisition system coupled to three PSDs with dimensions of 1 mm × 7 mm, 1 mm × 6 mm and 1 mm × 3.5 mm. The slightly poorer result of HS RP-200–1 × 1 can be explained by its smaller active volume compared to the probes used by Schoepper et al and Jean et al. The HS RP-200–1 × 1 demostrated noticeably worse linearity at low doses when compared to Exradin W1 and W2, which showed deviations of measured from expected dose of only 0.5% (over 0.15–6 Gy) and 0.05% (over 1–1000 MU), respectively (Carrasco et al 2015, Galavis et al 2019).
4.3. Dose rate dependence
For dose rates between 200 and 2400 MU min−1, the response was found to be independent of dose rate, given a difference of less than 0.10%. At 100 MU min−1 a difference of 0.48% was observed. For lower dose rates, this difference increased upwards 1.56% for 40 MU min−1. These findings are consistent with Carrasco et al (2015) who found a dose rate independence for Exradin W1 to within 0.5% for dose rates of 200–600 MU min−1 and within 1% for 100 MU min−1. Additionally, comparing to the HS RP-100 platform with 1 mm × 3 mm PSD probe, investigated by Schoepper et al (2022), they found dose rate independence to be within 1.18% for dose rates 200–600 MU min−1, and up to 3.6% difference for dose rates lower than 200 MU min−1. The findings in this report indicate an improved dose rate independence of HS RP-200–1 × 1 compared to larger PSD and earlier version of HS-RP-100 signal acquisition system found in literature.
4.4. Field size dependence (output factors and small field correction factors)
Given the good agreement of measured 6 MV-WFF energy beam detector specific output ratios for HS RP-200–1 × 1 to field output factors measured with PTW TN60019 microDiamond detectors for field sizes 1 × 1 cm2 and larger, we can make a conclusion that for this energy and these field sizes HS RP-200–1 × 1 small field output correction factor,  equates to a unity (
 ) within uncertainty of 2.5%. This can be expected considering the similarity of sensitive volume properties between Exradin W1 PSD and Medscint PSD used in this study. The small field output correction factors reported in TRS-483 for Exradin W1 are 1.000 for field sizes down to 0.4 × 0.4 cm2 IAEA (2017). However, as our measurements showed up to 5% disagreement of detector specific output ratios and field output factors at field sizes smaller than 1 × 1 cm2, further investigation is required to determine the values of
  for Medscint PSD at such fields. Monte Carlo simulations incorporating an accurate detector model based on manufacturer's specifications could be useful in resolving this discrepancy. In our study, two microDiamond detectors were utilized, advantageous in terms of cross-validation and measurement consistency. Nonetheless, we acknowledge that augmenting our study with various detector types or dosimetry techniques, such as film dosimetry, would have further enhanced the comprehensiveness of our findings.
Based on the agreement of measured 10 MV-FFF energy beam detector specific output ratios for HS RP-200–1 × 1 to field output factors measured with PTW TN60019 microDiamond detectors, we can make a conclusion that for 10 MV-FFF beam small field output correction factor,  for HS RP-200–1 × 1 equates to a unity (
 ) for field sizes of 2 × 2 cm2 and larger. For smaller fields, down to 0.5 × 0.5 cm2,
  is expected to be within 6% of unity. Further investigation is required to more accurately determine small field output correction factors for 10 MV-FFF energy at field sizes smaller than 2 × 2 cm2.
Lechner et al (2022) reported small field output factors measured on several linac models at multiple institutions using several detectors. For field sizes larger than 1 × 1 cm2, the output factors measured in this study agreed with the data reported by Lechner et al within 3%. However, for fields of 1 × 1 cm2 and smaller, considerable disagreement was found as shown in figures 4 and 6. Also, results reported by Lechner et al indicate a difference of over 45% between output factors measured on Varian TrueBeamTM STx (HD MLC) and Varian TrueBeamTM (Millenium MLC) for field size of 0.5 × 0.5 cm2. The detector specific output ratio measurements performed in this study did not show such a large difference between output factors for these models of Varian TrueBeamTM linacs. Our measurements on these two machines for beam energies of 6 MV-WFF and 10 MV-FFF showed output factor differences of up to 2.7% and 1.6% respectively, where the largest difference was measured at the smallest measured fields of 0.5 × 0.5 cm2. These differences are much smaller than those reported by Lechner et al, and the reason for the difference between our results and those by Lechner et al still needs to be clarified.
4.5. Angular dependence
The angular dependence, relative to gantry at 0°, of HS RP-200–1 × 1 was below 0.15%. This is in agreement with Carrasco et al (2015), who measured a maximum angular dependence of 0.34% for the Exradin W1, and Schoepper et al (2022) who measured a maximum angular dependence of 1.18% for HS RP-100 with 1 mm × 3 mm PSD probe. This finding indicates an isotropic response around the axis of symmetry for HS RP-200–1 × 1.
5. Conclusions
The HYPERSCINT RP-200 acquisition system coupled to a 1 mm diameter 1 mm long cylindrical PSD and HYPERDOSE analysis software presented very good short term repeatability, linear dose response, and independence of dose rate and axial angle. Detector specific output ratios were measured from 10 × 10 cm2 down to 0.25 × 0.25 cm2 for 6 MV-WFF and 10 MV-FFF energy beams. Small field output correction factors,  were determined to be 1.0 for field sizes 1 × 1 cm2 and larger for 6 MV-WFF beams, and also 1.0 for field sizes 2 × 2 cm2 and larger for 10 MV-FFF beams. Detector specific output ratios for very small fields, <1 × 1 cm2, showed differences up to 6.4% compared to those measured with other detectors, and this requires further investigation. Monte Carlo simulations would be helpful in resolving the discrepancy in small field output factors. Overall, the HS RP-200–1 × 1 makes for a simple to use dosimeter and has potential uses in SRS quality assurance and beam commissioning.
Acknowledgments
The authors would like to asknowledge training pertaining to the use of HYPERSCINT RP-200 provided by Alexander Hart, Benjamin Côté, and François Therriault-Proulx. Authors are grateful for the insightful comments, discussion, and suggestions by Dr Eyad Alhakeem. We aknowledge Dr Wolfgang Lechner for providing their measurement data. The authors would also like to thank the Canada Research Chairs program for NSERC Discovery Grant for funding the acquisition of HYPERSCINT RP-200 system. The authors thank Dr Ermias Gete for providing second microDiamond detector that we used in our measurements.
Data availability statement
The data cannot be made publicly available upon publication because no suitable repository exists for hosting data in this field of study. The data that support the findings of this study are available upon reasonable request from the authors.